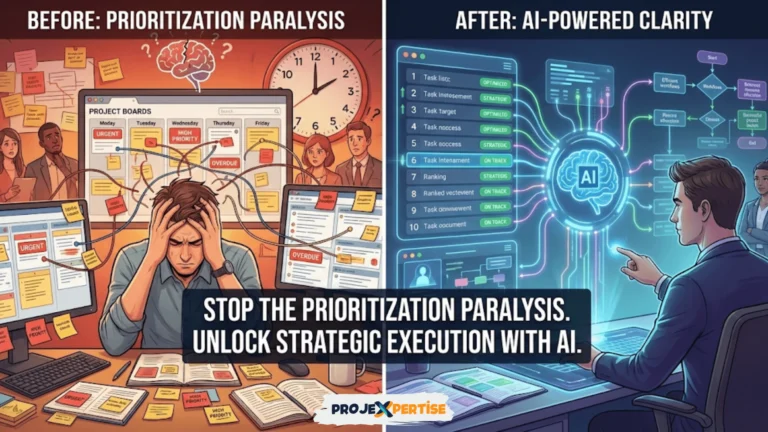
Gantt charts have revolutionized project management since their invention by Henry Gantt in the 1910s, transforming complex project schedules into visual, easy-to-understand timelines. Whether you’re managing a small team initiative or overseeing enterprise-level projects, mastering Gantt charts is essential for modern project managers seeking to deliver successful outcomes on time and within budget.
This comprehensive guide will walk you through everything you need to know about Gantt charts, from basic concepts to advanced implementation strategies. You’ll discover how these powerful visual tools can streamline your project workflows, enhance team collaboration, and significantly improve your project success rates.
What is a Gantt Chart?
Definition and Core Components
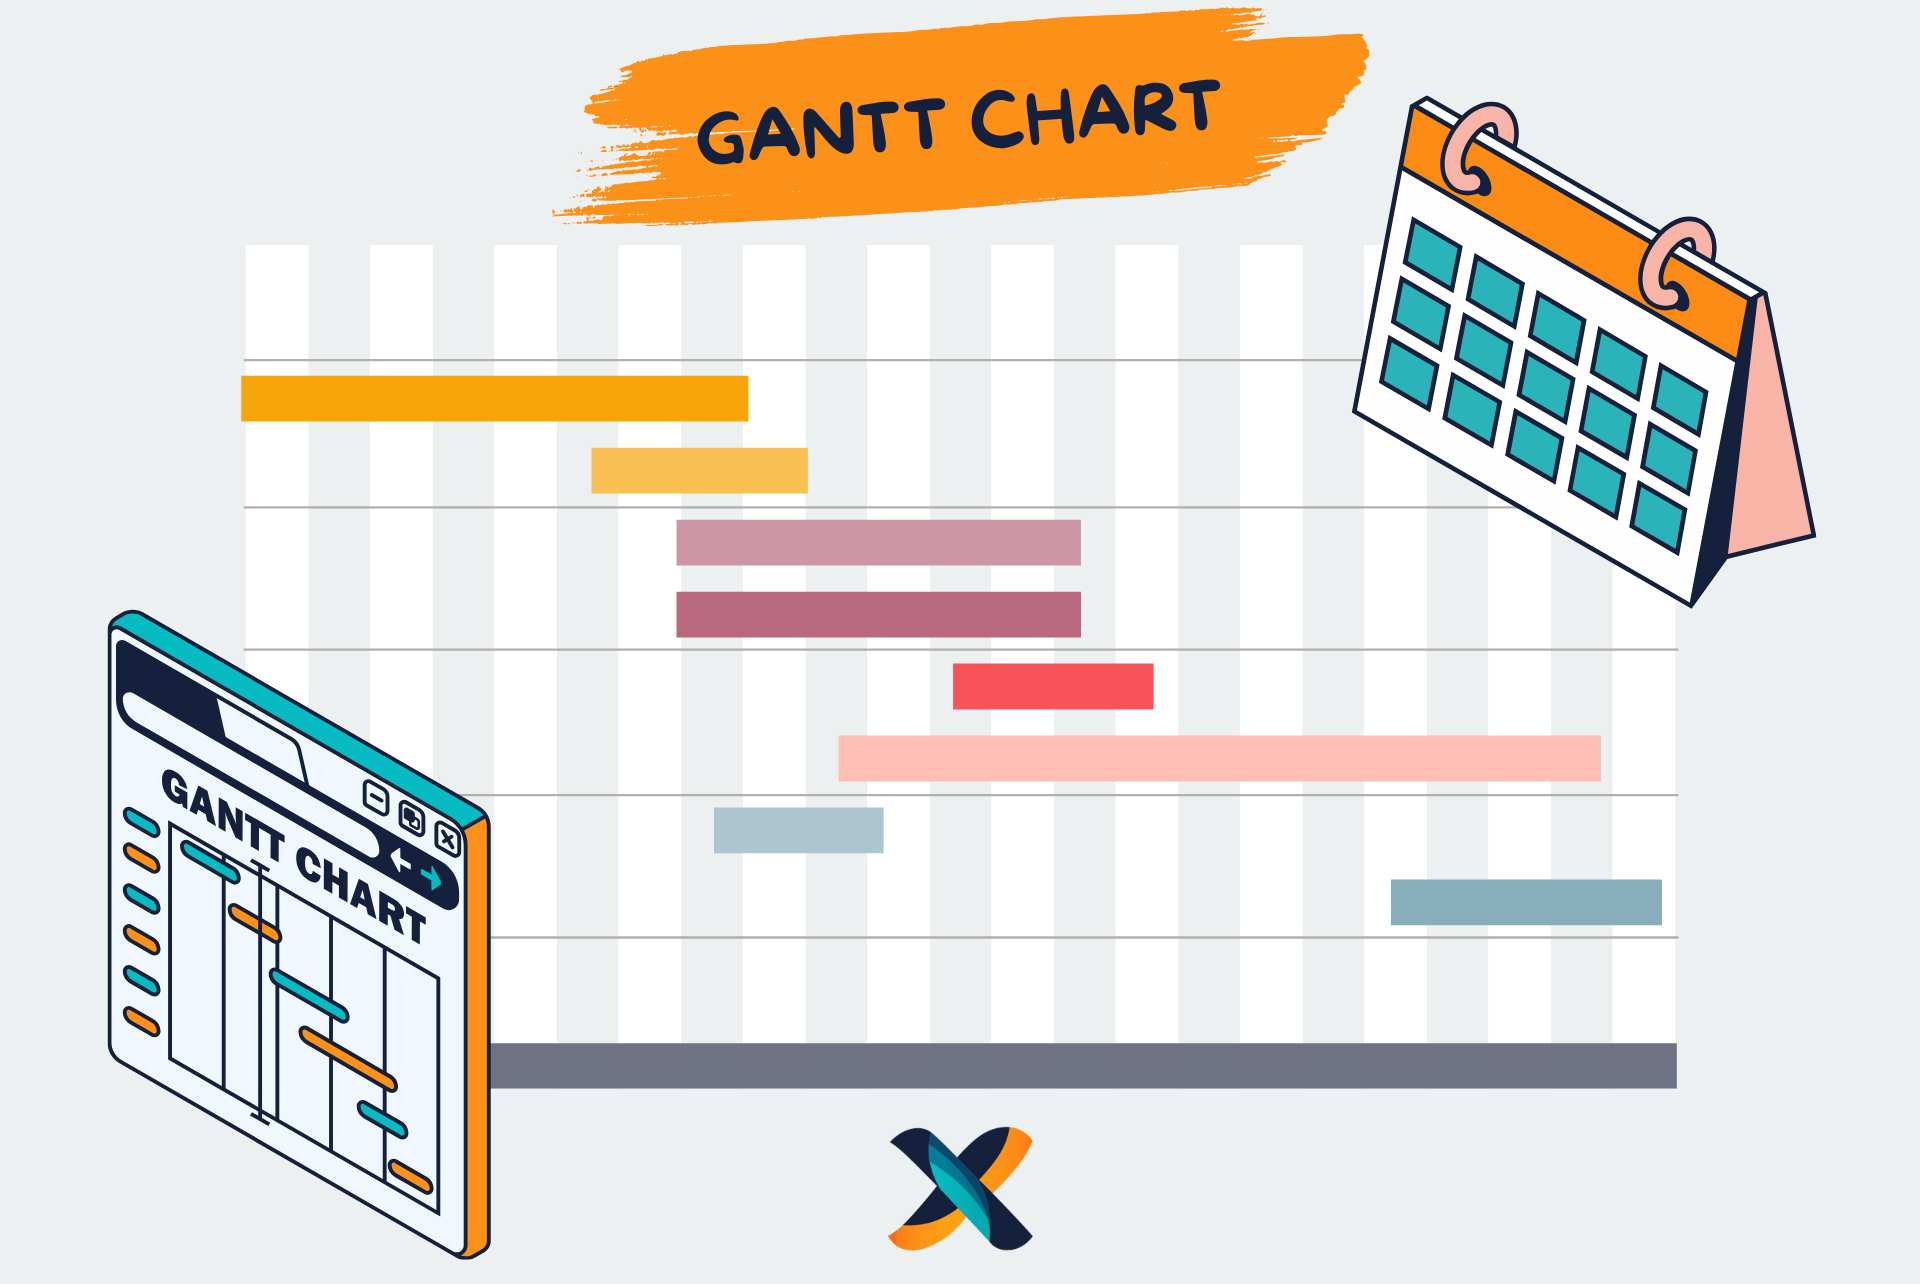
A Gantt chart is a horizontal bar chart that displays a project schedule along a timeline, with each bar representing a specific task or activity. Named after mechanical engineer Henry Gantt, this visualization tool has become the gold standard for project scheduling across industries worldwide.
The chart consists of several key elements that work together to provide a comprehensive project overview. The vertical axis lists all project tasks, while the horizontal axis represents the project timeline, typically divided into days, weeks, or months. Each horizontal bar spans from a task’s start date to its completion date, with the bar’s length indicating the task’s duration.
Modern Gantt charts also incorporate dependency arrows, which show relationships between tasks and highlight which activities must be completed before others can begin. Milestone markers indicate critical project deliverables or decision points, while resource allocation information shows who is responsible for each task.
Historical Context and Evolution
Henry Gantt originally developed these charts during World War I to improve production scheduling in manufacturing. The concept proved so effective that it quickly spread beyond industrial applications. Today, Gantt charts are used in construction, software development, marketing campaigns, event planning, and virtually every industry that requires project coordination.
The digital revolution has transformed Gantt charts from static paper documents into dynamic, interactive tools. Modern project management software now offers real-time updates, collaborative features, and integration capabilities that Henry Gantt could never have imagined.
Benefits of Using Gantt Charts
Clear Project Visualization and Timeline Management
One of the most significant advantages of Gantt charts is their ability to transform complex project information into an instantly understandable visual format. Project stakeholders can quickly grasp the project scope, timeline, and current status without wading through lengthy reports or status documents.
The visual nature of Gantt charts makes it easy to identify potential scheduling conflicts, resource bottlenecks, and critical path activities that could impact project delivery. Team members can see exactly how their work fits into the larger project context, fostering better understanding of their role’s importance and timing.
Research conducted by the Project Management Institute shows that projects using visual scheduling tools like Gantt charts have a 23% higher success rate compared to those relying solely on text-based project plans. This improvement stems from enhanced communication, better resource allocation, and more accurate progress tracking.
Enhanced Team Collaboration and Communication
Gantt charts serve as a universal language for project teams, breaking down communication barriers between different departments, skill levels, and organizational hierarchies. When everyone can see the same visual representation of the project, misunderstandings decrease dramatically, and alignment increases significantly.
The collaborative aspects of modern Gantt chart tools enable real-time updates and commentary, allowing team members to communicate progress, challenges, and changes directly within the project context. This centralized communication approach reduces email clutter and ensures that important project information doesn’t get lost in lengthy message threads.
Project managers report that teams using Gantt charts experience 40% fewer scheduling conflicts and 35% better deadline adherence compared to teams using traditional project management approaches. The visual clarity helps team members understand their dependencies on colleagues and plan their work accordingly.
Improved Resource Management and Allocation
Effective resource management becomes significantly easier with Gantt charts, as project managers can visualize workload distribution across team members and time periods. This visibility helps identify overallocated resources before they become overwhelmed and underutilized team members who could take on additional responsibilities.
The timeline view makes it simple to spot periods of high resource demand and plan accordingly, whether that means bringing in additional team members, adjusting deadlines, or redistributing tasks. Advanced project management tools integrated with Gantt charts can even provide cost analysis and budget tracking capabilities.
Resource leveling, the process of adjusting project schedules to optimize resource utilization, becomes much more manageable when you can see the entire project timeline and resource assignments in one view. This capability often leads to more realistic project schedules and better resource utilization rates.
How to Create a Gantt Chart: Step-by-Step Process
Step 1: Define Your Project Scope and Structure
Before creating your Gantt chart, you must thoroughly understand your project’s scope, objectives, and deliverables. Begin by conducting a comprehensive project analysis that identifies all major phases, activities, and sub-tasks required for successful completion.
Use a work breakdown structure (WBS) to decompose your project into manageable components. This hierarchical breakdown should start with major project phases and progressively detail specific tasks and activities. Each task should be small enough to be completed within a reasonable timeframe (typically 1-10 days) but large enough to represent meaningful progress.
Document task descriptions, success criteria, and acceptance criteria for each activity. This detailed planning phase, while time-intensive initially, will save countless hours during project execution by providing clear direction and reducing ambiguity. Consider involving key stakeholders and team members in this planning process to ensure nothing important is overlooked.
Step 2: Identify Task Dependencies and Relationships
Task dependencies are the backbone of effective Gantt chart scheduling, determining the logical sequence in which activities must be completed. There are four primary types of dependencies that you’ll encounter in most projects.
Finish-to-Start (FS) dependencies are the most common, where one task must be completed before another can begin. Start-to-Start (SS) dependencies allow tasks to begin simultaneously or with a slight delay. Finish-to-Finish (FF) dependencies require tasks to end at the same time or in sequence, while Start-to-Finish (SF) dependencies, though rare, occur when one task’s start triggers another task’s completion.
Understanding these relationships is crucial for creating realistic project schedules. Map out all dependencies carefully, as overlooking critical relationships can lead to unrealistic timelines and scheduling conflicts that become apparent only during project execution.
Step 3: Estimate Task Durations and Resource Requirements
Accurate duration estimation is both an art and a science, requiring historical data, expert judgment, and realistic assessment of available resources. Use multiple estimation techniques to improve accuracy, including expert opinion, analogous estimating, and parametric modeling when applicable.
Consider the skill level and availability of assigned resources when estimating durations. A task that takes an experienced team member two days might require four days for someone new to the area. Factor in potential interruptions, meetings, and other non-project activities that could impact productivity.
Build contingency buffers into your estimates, typically 10-20% for well-understood tasks and up to 50% for innovative or high-risk activities. Risk management tools can help you identify potential issues that might impact task durations and build appropriate buffers into your schedule.
Step 4: Select the Right Gantt Chart Tool
The tool you choose can significantly impact your Gantt chart’s effectiveness and your team’s adoption of the project management approach. Consider factors such as team size, project complexity, budget constraints, integration requirements, and user technical skill levels when making your selection.
Cloud-based solutions offer excellent collaboration features and accessibility but may have ongoing subscription costs. Desktop applications often provide more advanced features but may limit collaboration and mobile access. Some organizations prefer hybrid approaches that combine both cloud and desktop capabilities.
Evaluate the tool’s reporting capabilities, as stakeholders will likely require various project status reports throughout the project lifecycle. The ability to generate professional presentations, executive summaries, and detailed progress reports can save significant time and improve stakeholder communication.
Top Tools for Creating and Managing Gantt Charts
Microsoft Project: The Enterprise Standard
Microsoft Project remains the gold standard for enterprise project management, offering comprehensive Gantt chart functionality along with advanced features like resource leveling, cost management, and portfolio analysis. The software provides multiple project views, including Gantt charts, network diagrams, and resource histograms, making it suitable for complex projects with multiple interdependencies.
The tool’s strength lies in its robust scheduling engine, which automatically adjusts timelines when dependencies change or resources become unavailable. Microsoft Project’s integration with other Microsoft Office applications streamlines reporting and communication, while its enterprise features support multi-project management and resource sharing across organizational boundaries.
However, Microsoft Project’s learning curve can be steep, particularly for team members who haven’t used project management software before. The cost can also be prohibitive for smaller teams or organizations, with subscription plans starting at $10 per user per month for basic functionality.
Smartsheet: Spreadsheet Meets Project Management
Smartsheet bridges the gap between familiar spreadsheet interfaces and powerful project management functionality, making it an excellent choice for teams transitioning from basic Excel-based planning to professional project management tools. The platform’s Gantt chart features are intuitive and user-friendly, while still providing advanced capabilities like automated workflows and real-time collaboration.
The tool excels in its reporting and dashboard capabilities, offering customizable views that can be tailored to different stakeholder needs. Smartsheet’s automation features can update project status, send notifications, and trigger actions based on project milestones or deadline approaches.
Integration capabilities with popular business applications make Smartsheet attractive for organizations already using tools like Salesforce, Adobe Creative Suite, or DocuSign. Pricing starts at $7 per user per month, making it more affordable than enterprise solutions while still offering professional-grade functionality.
TeamGantt: Simplicity Without Compromise
TeamGantt focuses specifically on Gantt chart functionality, resulting in an exceptionally user-friendly interface that doesn’t overwhelm users with unnecessary features. The drag-and-drop functionality makes schedule adjustments intuitive, while the clean visual design helps stakeholders quickly understand project status and timelines.
The platform’s collaboration features include task commenting, file attachments, and progress updates that keep all stakeholders informed without cluttering the interface. TeamGantt’s time tracking capabilities help project managers monitor actual versus planned effort, providing valuable data for future project estimation.
The tool offers a generous free tier for small teams, with paid plans starting at $19 per month for up to five users. This pricing structure makes TeamGantt particularly attractive for small businesses and freelancers who need professional Gantt chart capabilities without enterprise-level complexity.
ClickUp: All-in-One Project Management
ClickUp has emerged as a comprehensive project management solution that includes robust Gantt chart functionality alongside task management, document collaboration, and team communication features. The platform’s flexibility allows teams to customize their workflow views, including traditional Gantt charts, Kanban boards, and calendar views.
The tool’s strength lies in its ability to serve as a central hub for all project-related activities, reducing the need for multiple separate applications. ClickUp’s automation capabilities can handle routine tasks like status updates and deadline reminders, freeing project managers to focus on higher-value activities.
ClickUp offers a competitive free tier and affordable paid plans, making professional project management accessible to teams of all sizes. The platform’s extensive customization options can be both a strength and a weakness, as some teams may find the number of available options overwhelming initially.
Asana: Task Management Meets Timeline Visualization
Asana’s approach to project management emphasizes task clarity and team collaboration, with Gantt chart functionality (called Timeline view) seamlessly integrated into the platform’s broader project management ecosystem. The tool excels at breaking down complex projects into manageable tasks while maintaining visibility into the overall project timeline.
The platform’s strength lies in its intuitive task creation and assignment process, making it easy for teams to capture and organize work as it emerges. Asana’s proofing and approval features are particularly valuable for creative projects that require multiple review cycles and stakeholder feedback.
Asana’s free tier supports teams of up to 15 members with basic Gantt chart functionality, while paid plans starting at $10.99 per user per month unlock advanced features like custom fields, advanced search, and reporting capabilities.
Advanced Gantt Chart Features and Techniques
Critical Path Analysis and Optimization
The critical path represents the longest sequence of dependent tasks that determines the minimum project duration. Understanding and managing your project’s critical path is essential for effective schedule control, as any delays to critical path activities will directly impact your project’s completion date.
Modern Gantt chart software automatically calculates and highlights the critical path, making it easy to identify which tasks require the most attention and monitoring. Project managers can use this information to allocate their best resources to critical activities, build additional buffers into high-risk critical tasks, and focus their daily attention where it will have the most impact.
Critical path analysis also reveals scheduling flexibility for non-critical tasks through the concept of float or slack time. Tasks with significant float can often be delayed without impacting the overall project schedule, providing valuable flexibility for resource leveling and risk mitigation strategies.
Resource Leveling and Optimization
Resource leveling addresses the common challenge of resource over-allocation by adjusting task schedules to smooth resource demand across the project timeline. This process often involves extending project duration to achieve more realistic resource utilization, but the trade-off typically results in more sustainable work patterns and higher quality deliverables.
Advanced project management tools can perform resource leveling automatically, but successful implementation requires project managers to understand the underlying principles and trade-offs involved. Sometimes extending the project timeline by a few days can eliminate unsustainable workload peaks that would otherwise lead to team burnout and quality issues.
Consider implementing resource pools and skill-based resource allocation to maximize flexibility in resource assignment. This approach allows multiple projects to share resources efficiently while maintaining clear accountability and work prioritization.
Integration with Other Business Systems
Modern organizations benefit significantly from integrating Gantt chart tools with other business systems such as customer relationship management (CRM) software, financial systems, and human resource management platforms. These integrations eliminate duplicate data entry, improve accuracy, and provide stakeholders with comprehensive business intelligence.
CRM integration enables project managers to link projects directly to customer accounts, automatically trigger project initiation from sales processes, and provide customers with real-time project status updates. Financial system integration supports budget tracking, cost analysis, and profitability assessment at both task and project levels.
Human resource integration facilitates resource planning by providing access to employee skills, availability, and performance data. This information helps project managers make better resource allocation decisions and identify training needs that could improve future project performance.
Best Practices for Gantt Chart Success
Establishing Regular Update Rhythms
Successful Gantt chart implementation requires consistent maintenance and updates to remain accurate and useful. Establish regular update cycles that align with your project’s pace and complexity, typically ranging from daily updates for fast-moving projects to weekly updates for longer-term initiatives.
Create standardized processes for collecting task status updates from team members, including completion percentages, remaining duration estimates, and any obstacles or risks that could impact future progress. Workflow automation tools can streamline this process by sending automatic reminders and collecting standardized status reports.
Document changes and their rationale to maintain project history and support lessons learned activities. Understanding why schedule changes were made helps improve future project estimation and planning processes while providing valuable context for stakeholders who join the project later.
Stakeholder Communication and Engagement
Different stakeholders require different levels of detail and frequency in project communications. Executive stakeholders typically prefer high-level milestone views with clear indication of overall project health and key risks. Team members need detailed task information with clear dependencies and deadlines.
Develop multiple view configurations within your Gantt chart tool to support different stakeholder needs without overwhelming anyone with unnecessary detail. Many tools support saved filters and custom dashboards that can be shared with specific stakeholder groups.
Create project dashboards that combine Gantt chart information with other relevant project metrics such as budget utilization, quality indicators, and risk assessments. These comprehensive views help stakeholders understand project performance holistically rather than focusing solely on schedule adherence.
Continuous Improvement and Lessons Learned
Implement systematic processes for capturing lessons learned throughout the project lifecycle, not just at project completion. Regular retrospective meetings can identify process improvements, tool enhancements, and estimation refinements that will benefit future projects.
Track estimation accuracy over time to improve your team’s planning capabilities. Analyze variance between planned and actual durations to identify patterns that might indicate systematic estimation bias or external factors that consistently impact project performance.
Consider implementing project templates based on successful project patterns to accelerate future project planning and improve consistency across your organization’s project portfolio.
Common Pitfalls and How to Avoid Them
Over-Detailed Planning and Micromanagement
One of the most common mistakes new Gantt chart users make is creating overly detailed schedules that become burdensome to maintain and inhibit team autonomy. While detailed planning is valuable, excessive granularity can lead to administrative overhead that outweighs the benefits of project visualization.
Focus on meaningful milestones and deliverables rather than tracking every minor activity. A good rule of thumb is that individual tasks should represent 4-40 hours of effort, providing enough detail for effective monitoring without overwhelming the schedule with minutiae.
Trust your team members to manage their individual work methods while holding them accountable for deliverable quality and timing. The Gantt chart should facilitate coordination and communication, not replace professional judgment and individual initiative.
Ignoring Resource Constraints and Dependencies
Creating schedules that ignore resource availability and capacity limitations leads to unrealistic timelines that inevitably fail during execution. Always validate your Gantt chart against available resources, considering factors such as individual skill levels, competing priorities, and organizational capacity constraints.
Pay particular attention to shared resources that support multiple projects simultaneously. These resources often become bottlenecks that can cascade delays across multiple project timelines if not carefully managed and scheduled.
Build realistic assumptions about resource productivity into your planning, recognizing that people are not interchangeable and that context switching between tasks and projects reduces overall efficiency.
Failure to Adapt and Update
Static Gantt charts that don’t evolve with changing project realities quickly become irrelevant and lose stakeholder confidence. Establish clear processes for incorporating scope changes, resource adjustments, and timeline modifications into your project schedule.
Communicate changes promptly to all affected stakeholders, explaining the rationale and impact of schedule modifications. Transparency about changes builds trust and helps stakeholders make informed decisions about their own work and commitments.
Use version control and change tracking features to maintain visibility into schedule evolution over time. This historical information proves valuable for understanding project dynamics and improving future planning processes.
Measuring Success and ROI
Key Performance Indicators for Gantt Chart Implementation
Successful Gantt chart implementation should result in measurable improvements in project performance, team satisfaction, and stakeholder confidence. Establish baseline measurements before implementation and track key metrics such as on-time delivery rates, budget adherence, scope creep frequency, and team productivity indicators.
Monitor stakeholder satisfaction through regular surveys and feedback sessions, paying particular attention to communication effectiveness, clarity of expectations, and confidence in project delivery. These subjective measures often provide early indicators of implementation success or areas needing attention.
Track ROI metrics that demonstrate the business value of improved project management processes, including reduced project duration, lower resource costs, and improved quality outcomes. These measurements help justify continued investment in project management tools and training.
Long-term Benefits and Organizational Maturity
Organizations that successfully implement Gantt chart-based project management typically experience improved project success rates, better resource utilization, and enhanced stakeholder satisfaction over time. These benefits compound as teams develop experience and confidence with visual project management approaches.
The structured approach required for effective Gantt chart creation often leads to improvements in overall project planning and estimation capabilities. Teams learn to think more systematically about project requirements, dependencies, and risks, resulting in better project outcomes even beyond schedule management.
Consider Gantt chart implementation as part of a broader organizational project management maturity journey rather than a standalone tool adoption. The discipline and processes required for successful Gantt chart usage support improvements across all aspects of project management practice.
Frequently Asked Questions
Can Gantt charts be effectively used for Agile projects?
While Gantt charts originated in traditional project management environments, they can be adapted for Agile projects with some modifications to accommodate iterative development and changing requirements. Many Agile teams use Gantt charts for high-level release planning while maintaining flexibility at the sprint level through other tools like Kanban boards or sprint planning sheets.
The key to successful Agile Gantt chart implementation is focusing on major milestones, release dates, and dependencies between teams or components rather than attempting to schedule individual user stories or tasks in detail. This approach provides stakeholder visibility into long-term plans while preserving the flexibility that makes Agile methodologies effective.
Some teams find success using hybrid approaches that combine Gantt charts for external communication and milestone tracking with more flexible tools for day-to-day sprint management and task allocation.
What’s the best Gantt chart tool for beginners?
For beginners, TeamGantt and Trello with Power-Ups offer the most accessible entry points into Gantt chart-based project management. These tools prioritize ease of use and visual clarity over advanced features, making them ideal for teams new to formal project management processes.
TeamGantt’s drag-and-drop interface and clean visual design help new users understand Gantt chart concepts quickly, while Trello’s familiar card-based interface with Gantt chart overlays provides a gentle transition from simple task management to timeline-based project planning.
Consider starting with free or low-cost options to build team confidence and understanding before investing in more advanced tools with steeper learning curves and higher costs.
How often should a Gantt chart be updated?
Update frequency should align with project pace and stakeholder needs, typically ranging from daily updates for critical, fast-moving projects to weekly updates for longer-term initiatives. The key is consistency rather than any specific frequency, as stakeholders need to trust that the information they’re seeing is current and accurate.
Establish clear expectations with team members about when and how they should report progress, and build these communication rhythms into your project processes. Many teams find success with weekly status meetings where Gantt chart updates are reviewed and discussed collaboratively.
Consider implementing automated progress tracking where possible to reduce the administrative burden of manual updates while maintaining accuracy and timeliness in project reporting.
How do I handle scope changes in my Gantt chart?
Scope changes are inevitable in most projects, and your Gantt chart should be flexible enough to accommodate necessary adjustments without losing its value as a planning and communication tool. Establish a formal change control process that evaluates the impact of proposed changes on schedule, resources, and budget before making modifications.
When implementing approved changes, update your Gantt chart promptly and communicate the changes to all affected stakeholders. Use version control features to maintain visibility into what changed and why, helping stakeholders understand the evolution of project requirements and timelines.
Consider maintaining both baseline and current schedule views to show the impact of changes over time. This historical perspective helps stakeholders understand project dynamics and supports more informed decision-making about future change requests.
Taking Your Project Management to the Next Level
Gantt charts represent a powerful foundation for professional project management, but their true value emerges when combined with broader project management best practices and organizational commitment to structured planning and execution. The visual clarity and communication benefits of well-implemented Gantt charts can transform team collaboration and stakeholder engagement.
Success with Gantt charts requires more than just selecting the right tool or creating detailed schedules. It demands commitment to regular maintenance, stakeholder communication, and continuous improvement based on project experience and lessons learned. Organizations that invest in developing these capabilities typically see significant improvements in project success rates and team satisfaction.
Start your Gantt chart journey with realistic expectations and a commitment to learning and adaptation. Begin with simple projects to build confidence and capability before tackling more complex initiatives. Remember that the goal is improved project outcomes, not perfect adherence to any specific methodology or tool.
The project management landscape continues to evolve with new tools, techniques, and approaches emerging regularly. Gantt charts remain relevant because they address fundamental human needs for visualization, communication, and coordination that transcend specific technologies or methodologies. By mastering these foundational concepts, you’ll be well-positioned to adapt and thrive regardless of how project management practices continue to evolve.